Part of the Mobile Development series
Xcode Debugging Tools
As I started my official iOS career in 2020, there were some tips and tricks in using Xcode to debug issues that I picked up along the way. This is an ongoing post in which I’ll continue to add my lesson learns as I become exposed to them and find it useful to share with others.
Most of the tools that we will be going over are listed in the debug menu shown below:

UI Test Recorder
Going from left to right, you’ll see a red record button. If you are planning on implementing UI tests, this is helpful in generating automatic code for you. First, create a UI test case and then press the record button which will run the simulator. Now, the recorder will attempt to write code that matches the actions you take in the Simulator. Although I tend to write the code myself, this is useful in understanding how Xcode will interpret your actions and can provide insight on some names and what type of element you are interacting with.
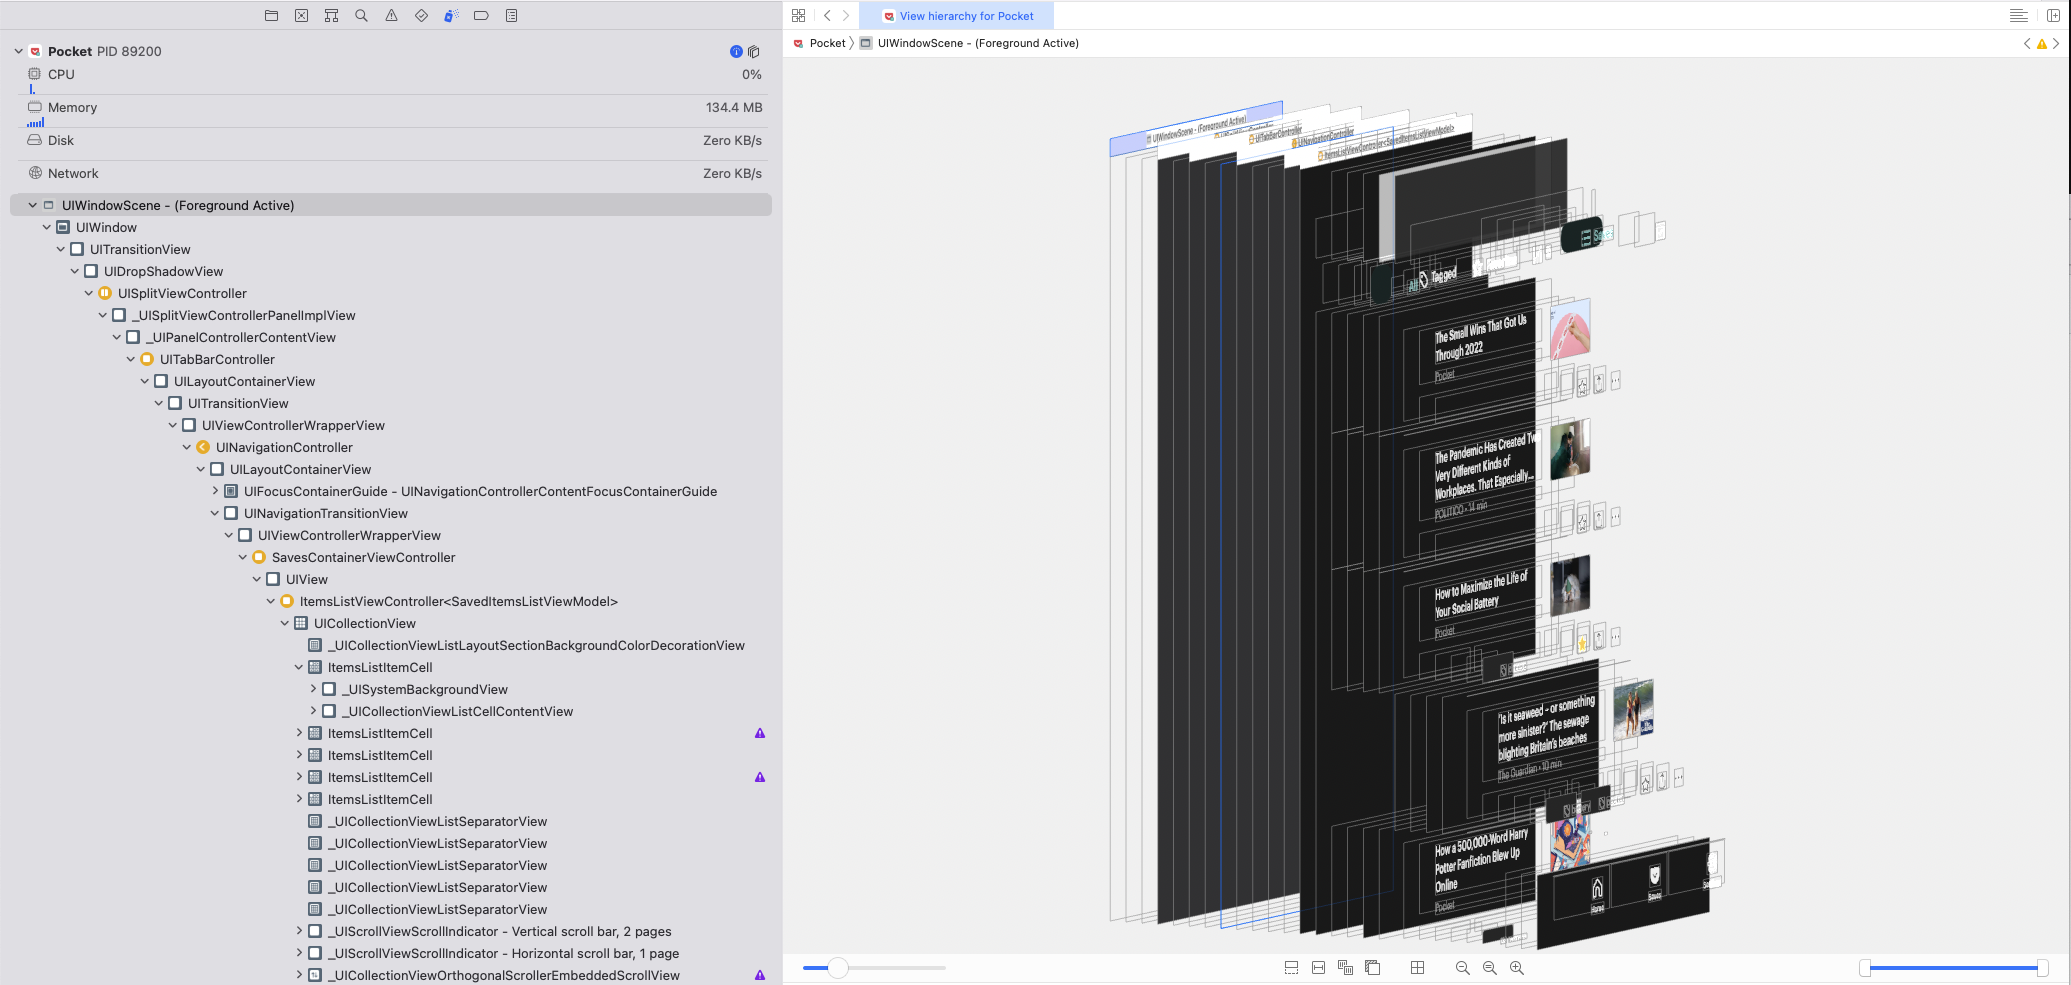
View Hierarchy
As someone who is passionate about the UI, I really like this view hierarchy because you can see the layers of different UI elements that are appearing. It is useful if you have some weird UI bug to address as and want to see what the hierarchy looks like and there are attributes for each element.

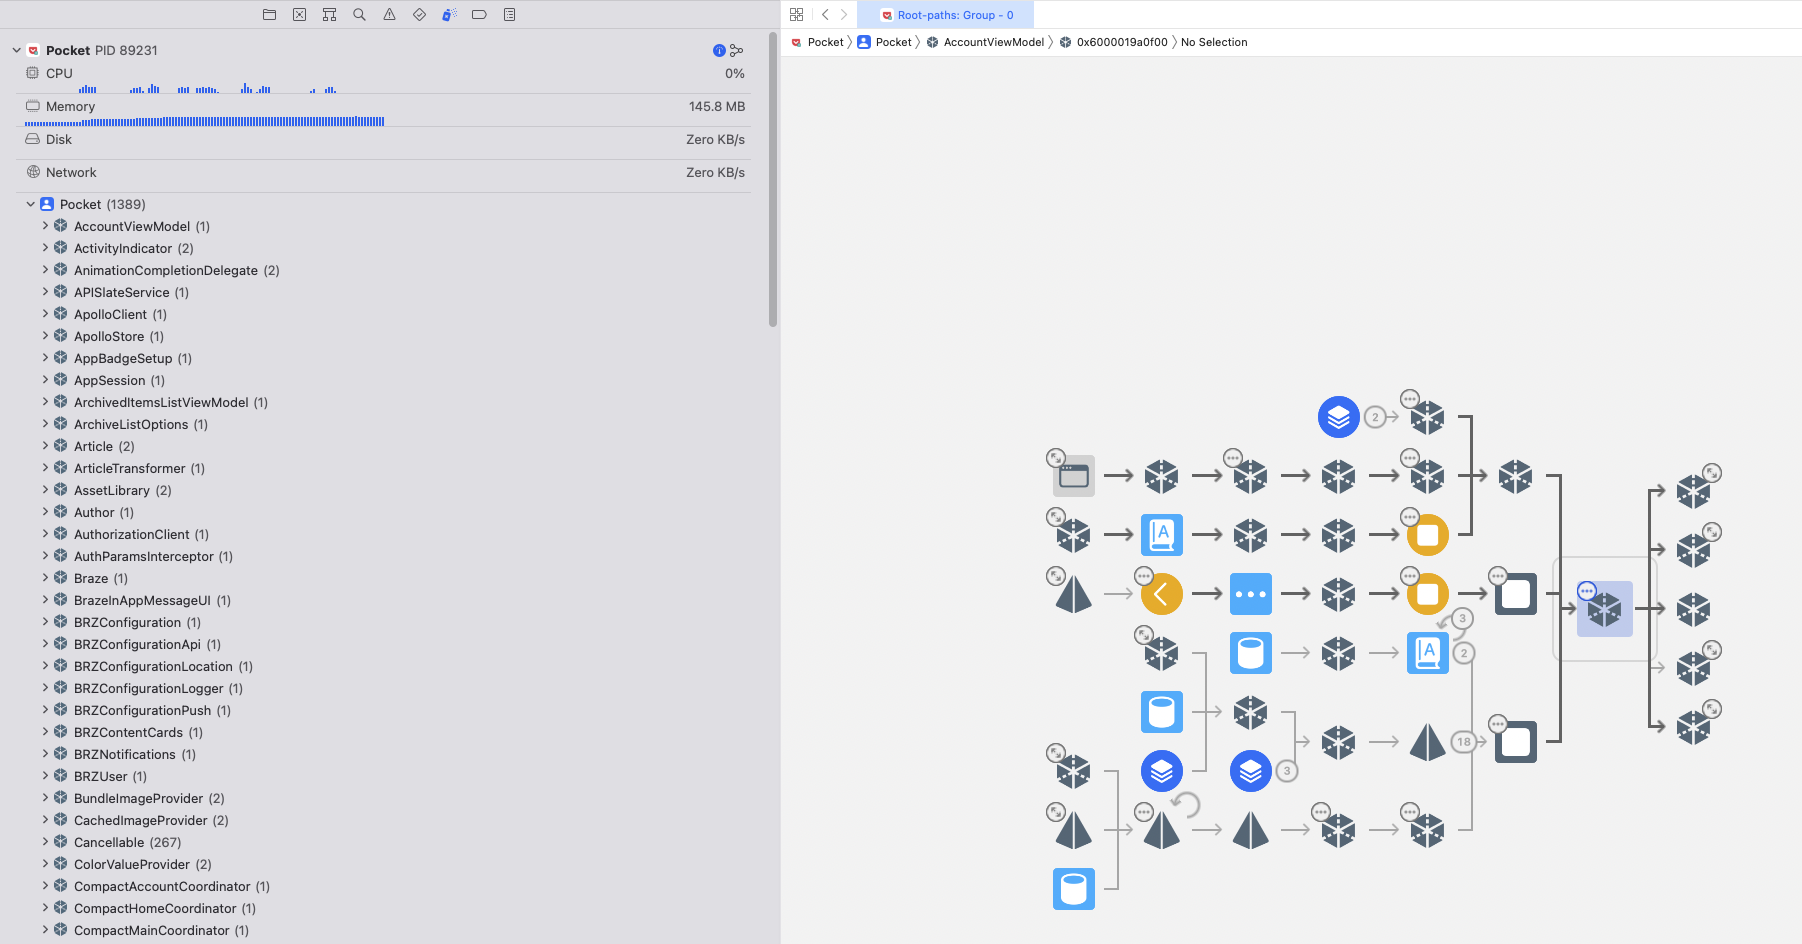
Memory Debugger
Although I rarely use the memory debugger, it helps to know that this tool is available and provides more insight when there is a memory leak and you can see if an instance is created multiple times. This will give is a clue is something should be deallocated.

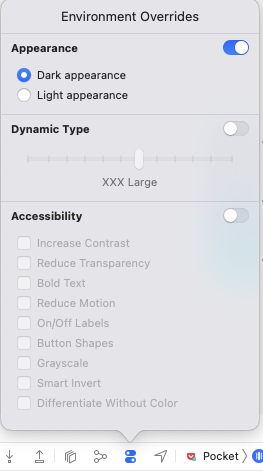
Environment Overrides
Accessibility is usually seen as the last thing and sometimes isn’t emphasized when it comes to building features. However, I definitely think it should be a consideration throughout if not at the beginning. The environmental overrides is useful for making sure that the app works in different environments. The environments could be based of dark mode, text sizes or other accessibility details.


